Pipelines that match how you actually sell
Multiple pipelines per workspace. Four ways to measure deal value. Kanban or table view, your call. Floral does not assume every sales motion is mid-market SaaS — pick the value mode that works for new business, upsell, advisory, or whatever you actually run.
Drag-and-drop kanban or list view
Kanban for the daily standup
Drag deals between stages. Forecast strip at the top shows weighted open value, count per stage, and total open value. Each card surfaces deal name, value, primary contact, expected close date, and owner avatars.
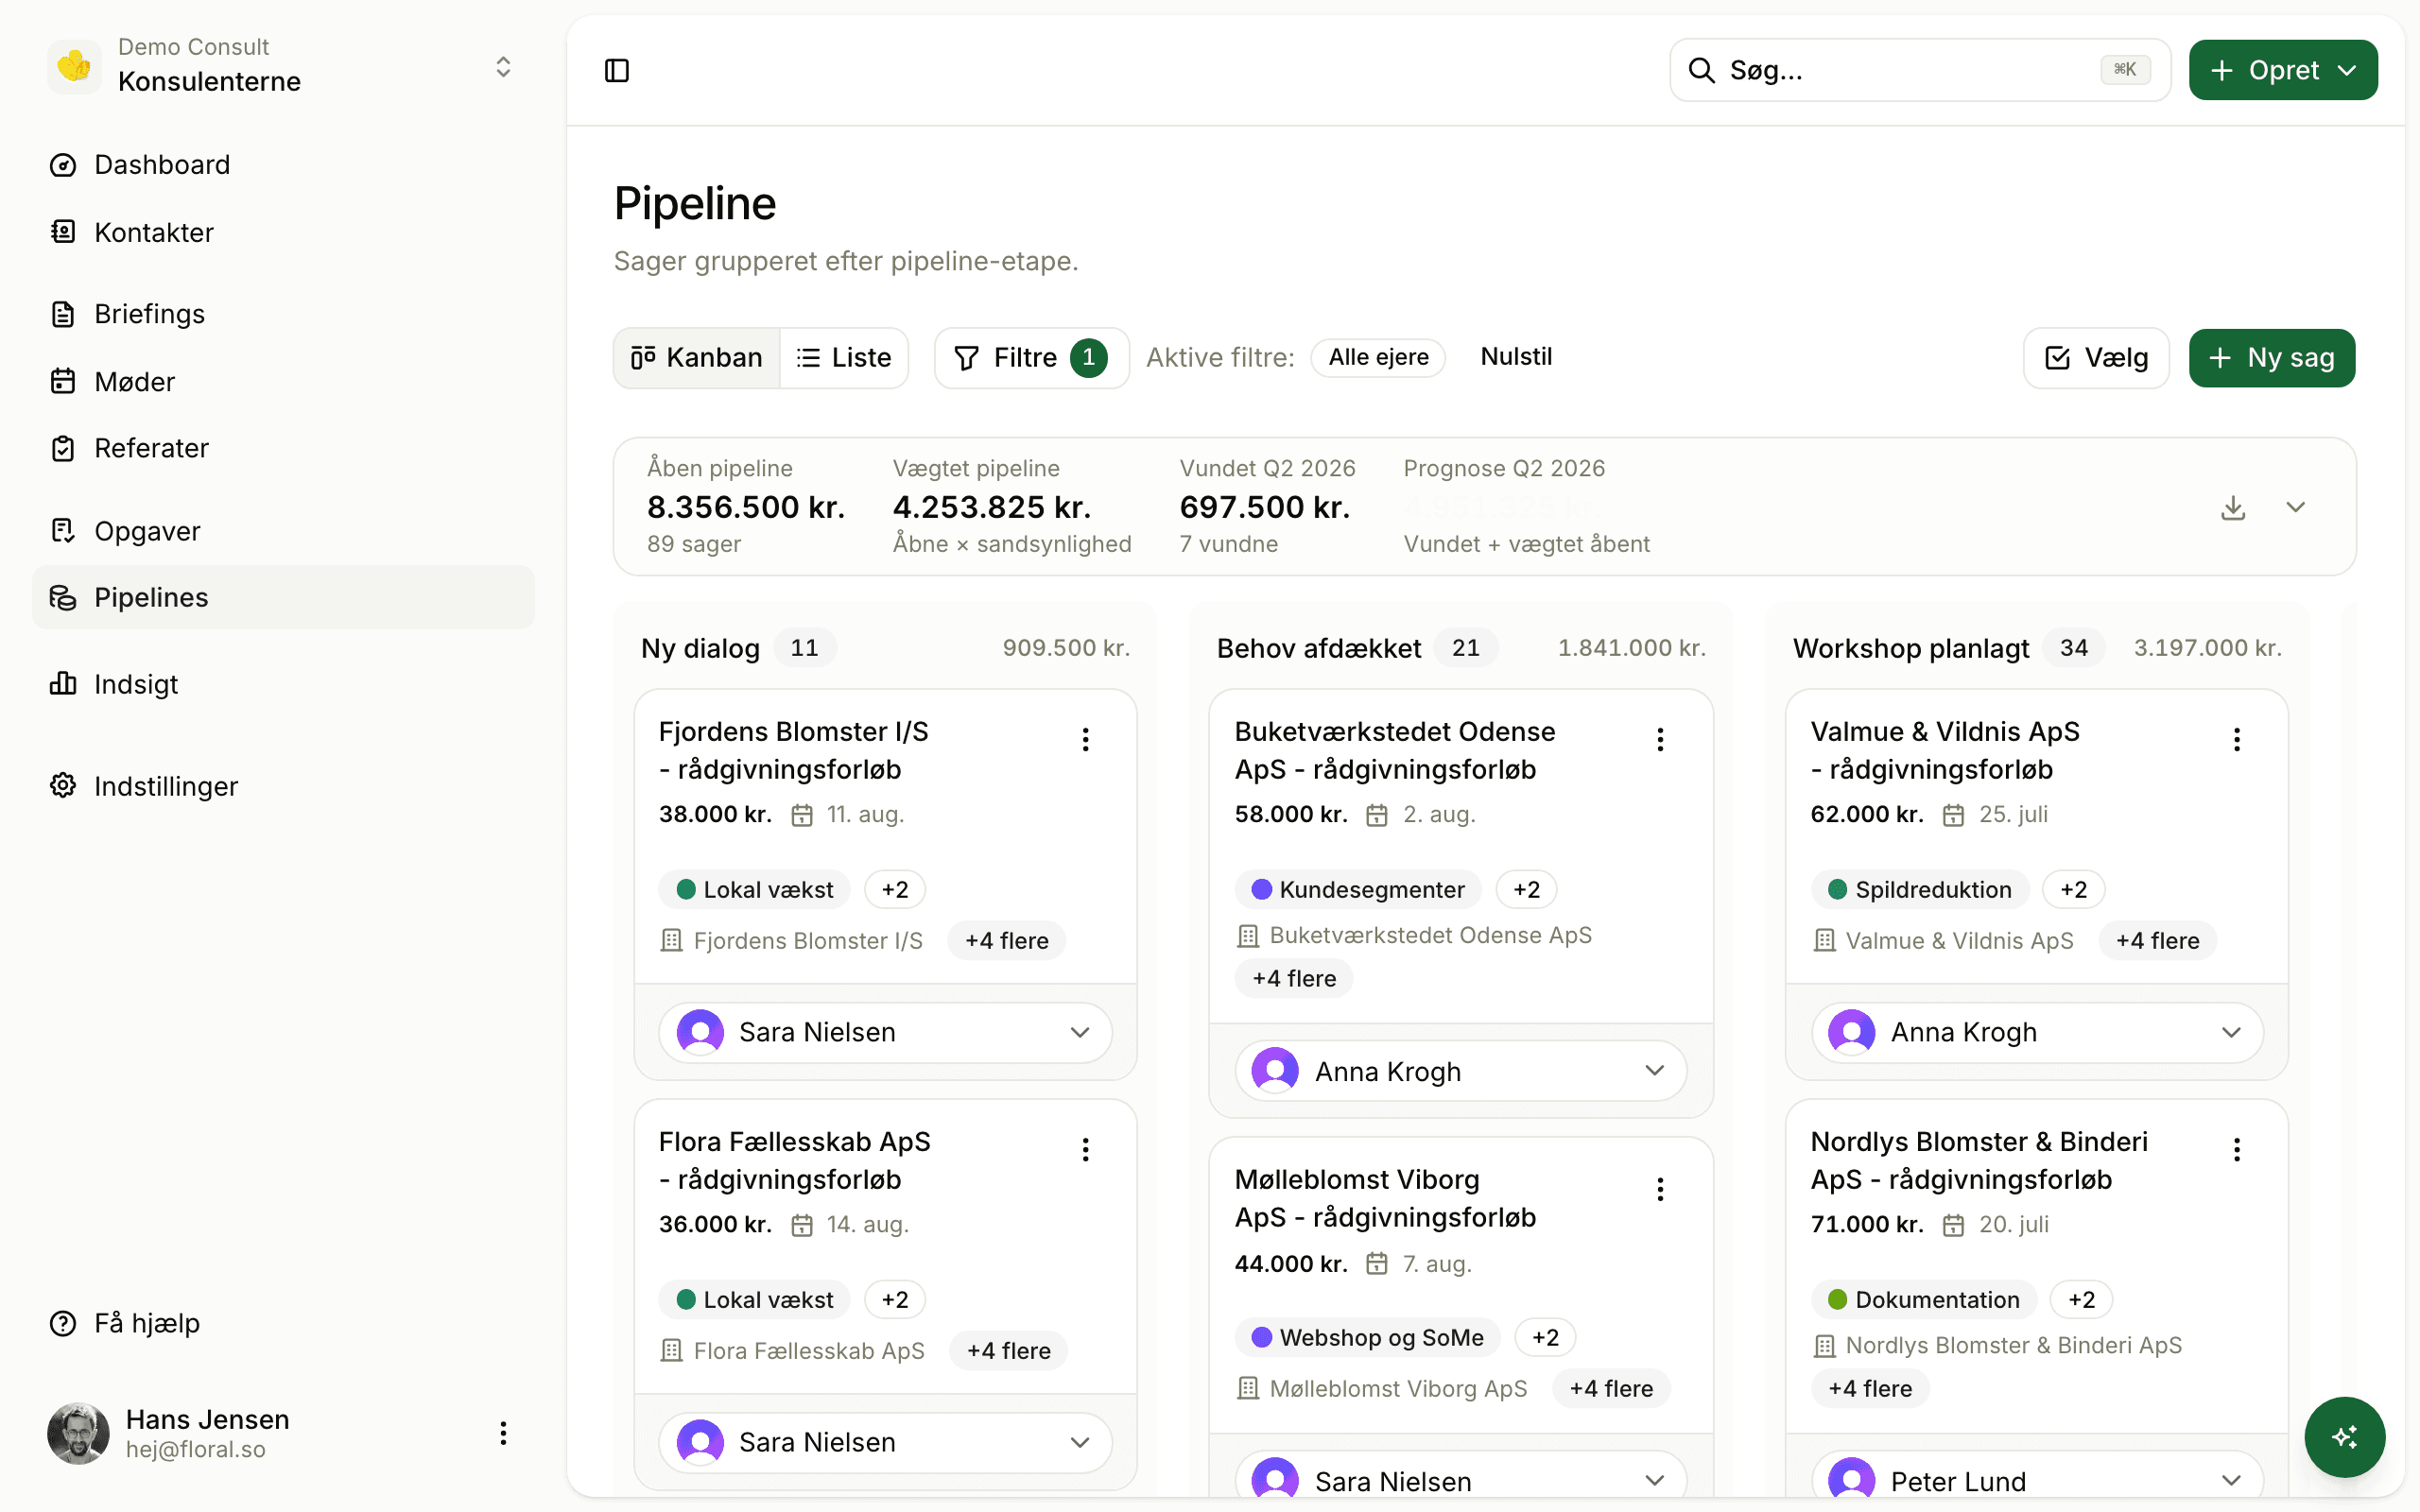
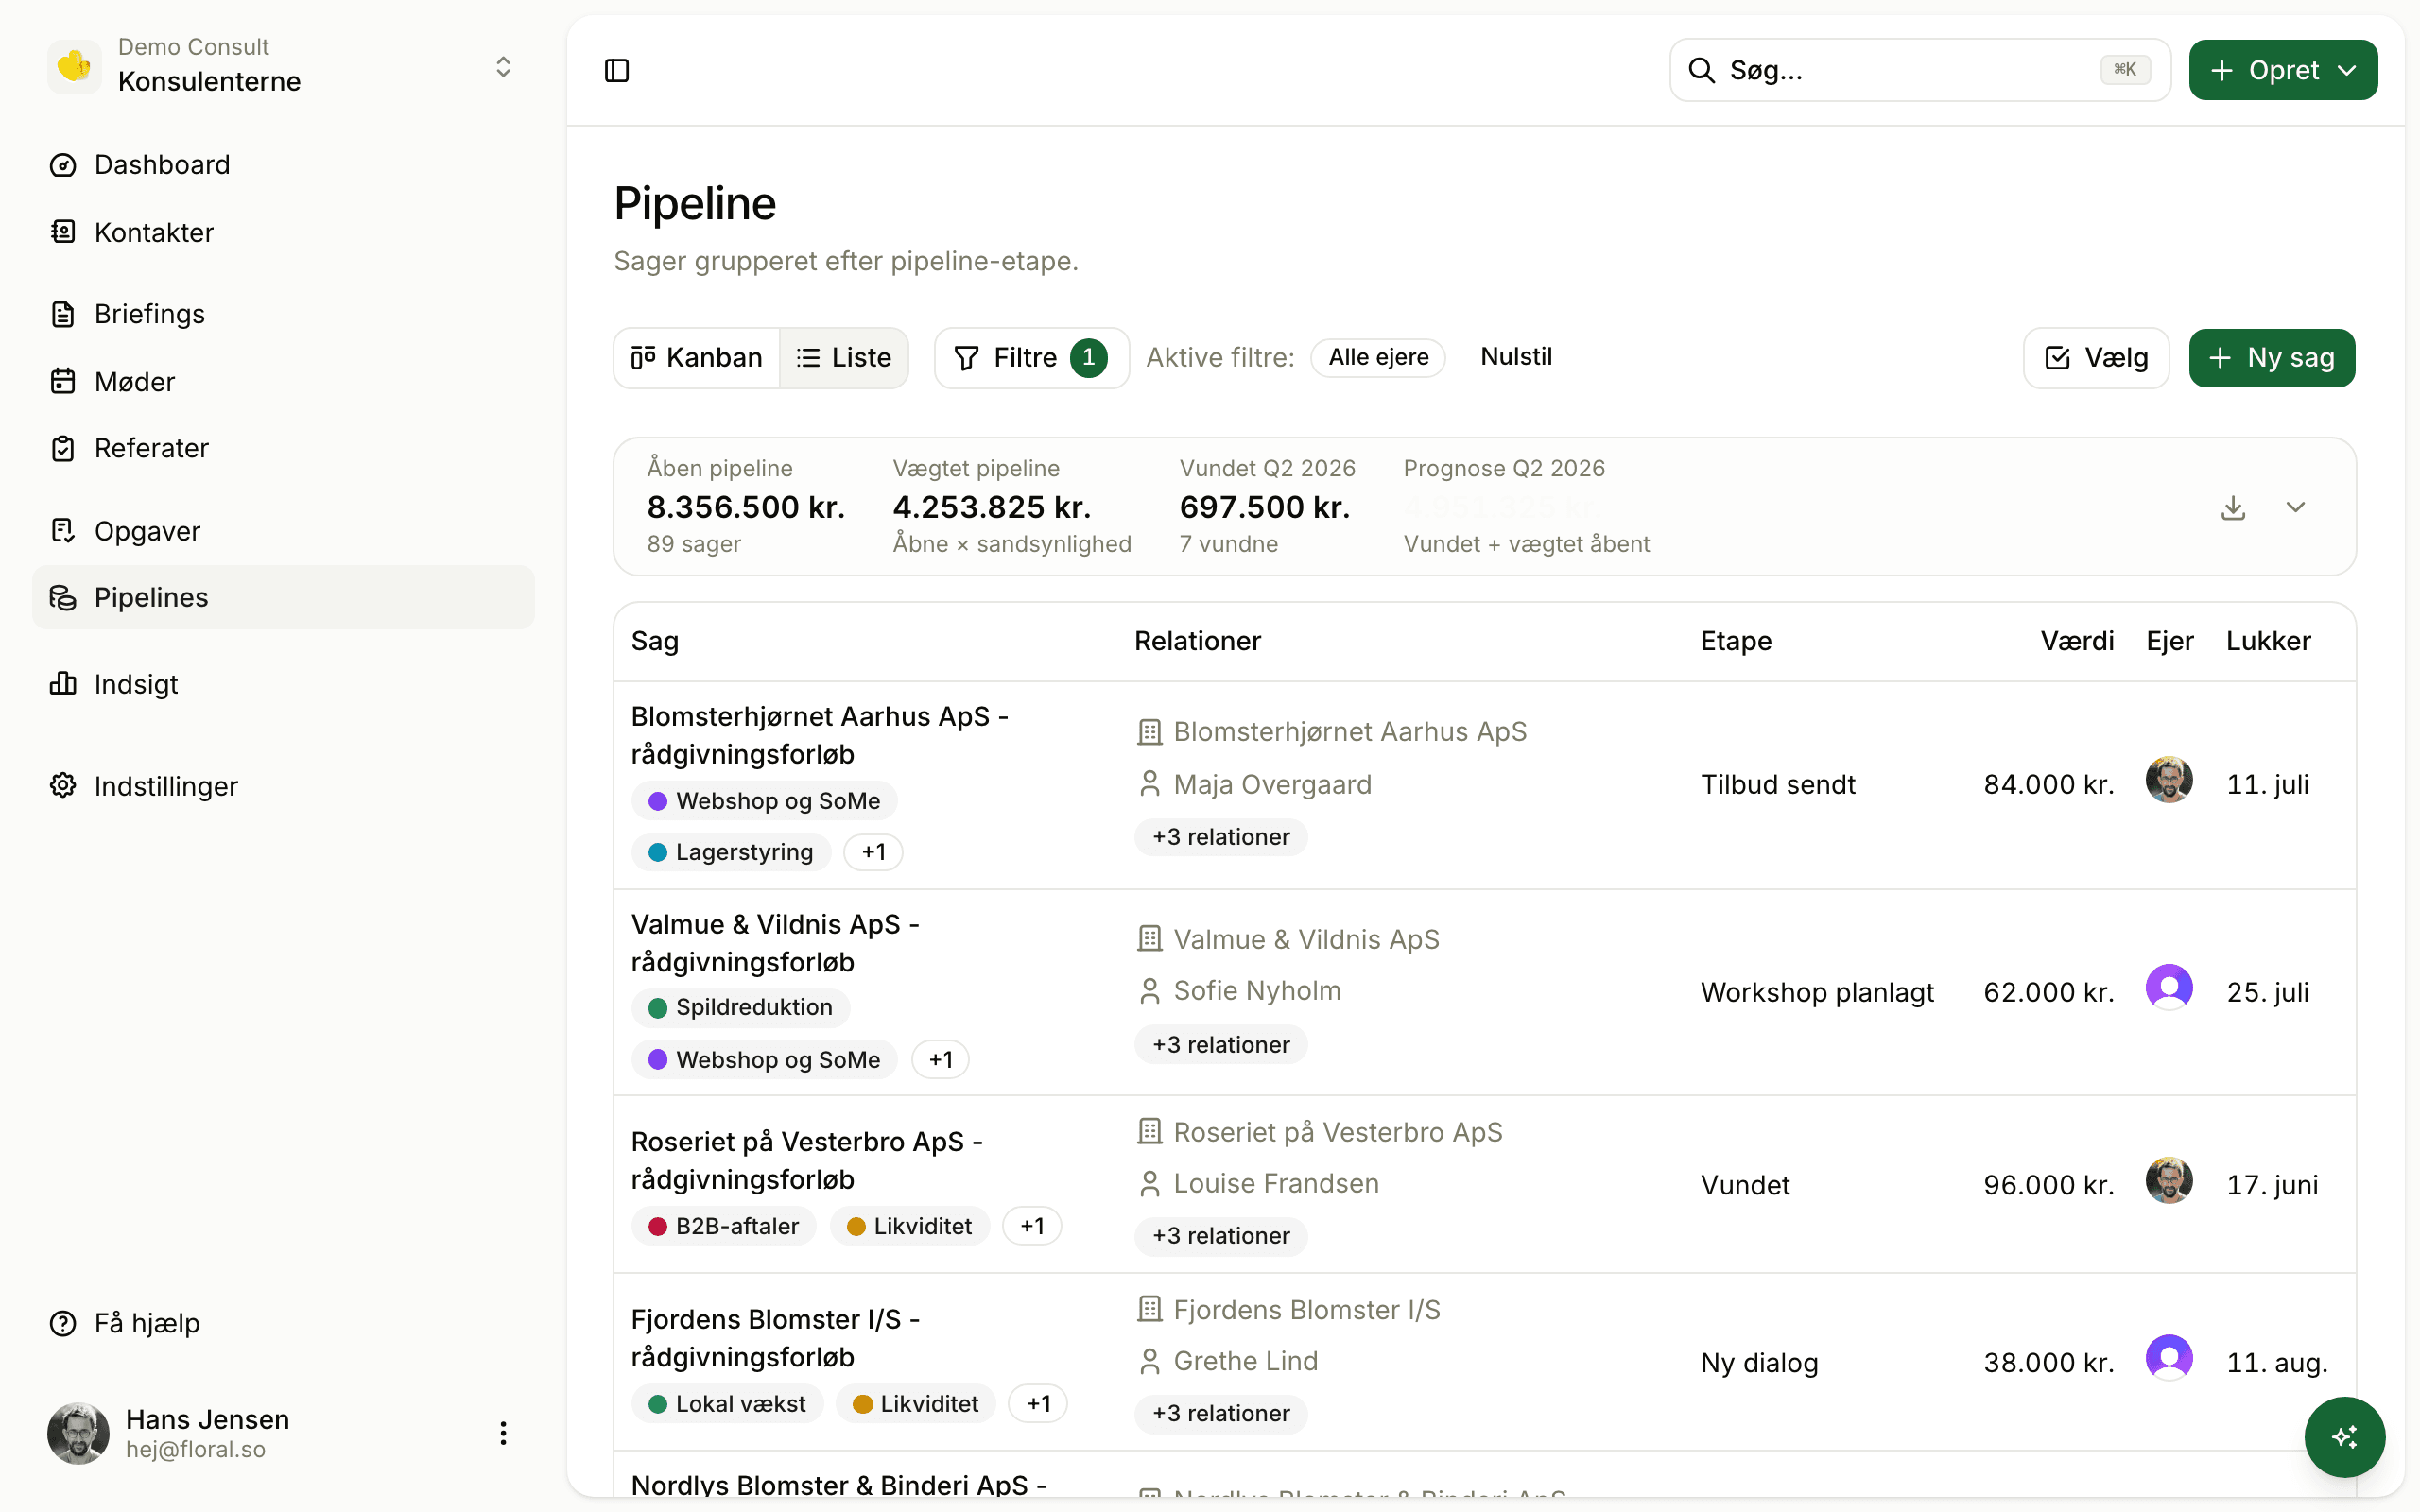
Table view for the deep dive
Same data, table layout. Sort by value, age in stage, or expected close. Filter by owner, stage, tags, or custom fields. Bulk-edit selections — owner, stage, tag, pipeline — without dragging.
Configure every stage
Each pipeline has its own stages. Each stage has a default probability, an optional fixed value (for stage-based value mode), and optional auto-win or auto-lose behaviour. Drag to reorder. Stage deletion is blocked if any deal still sits in it — no orphaned data.
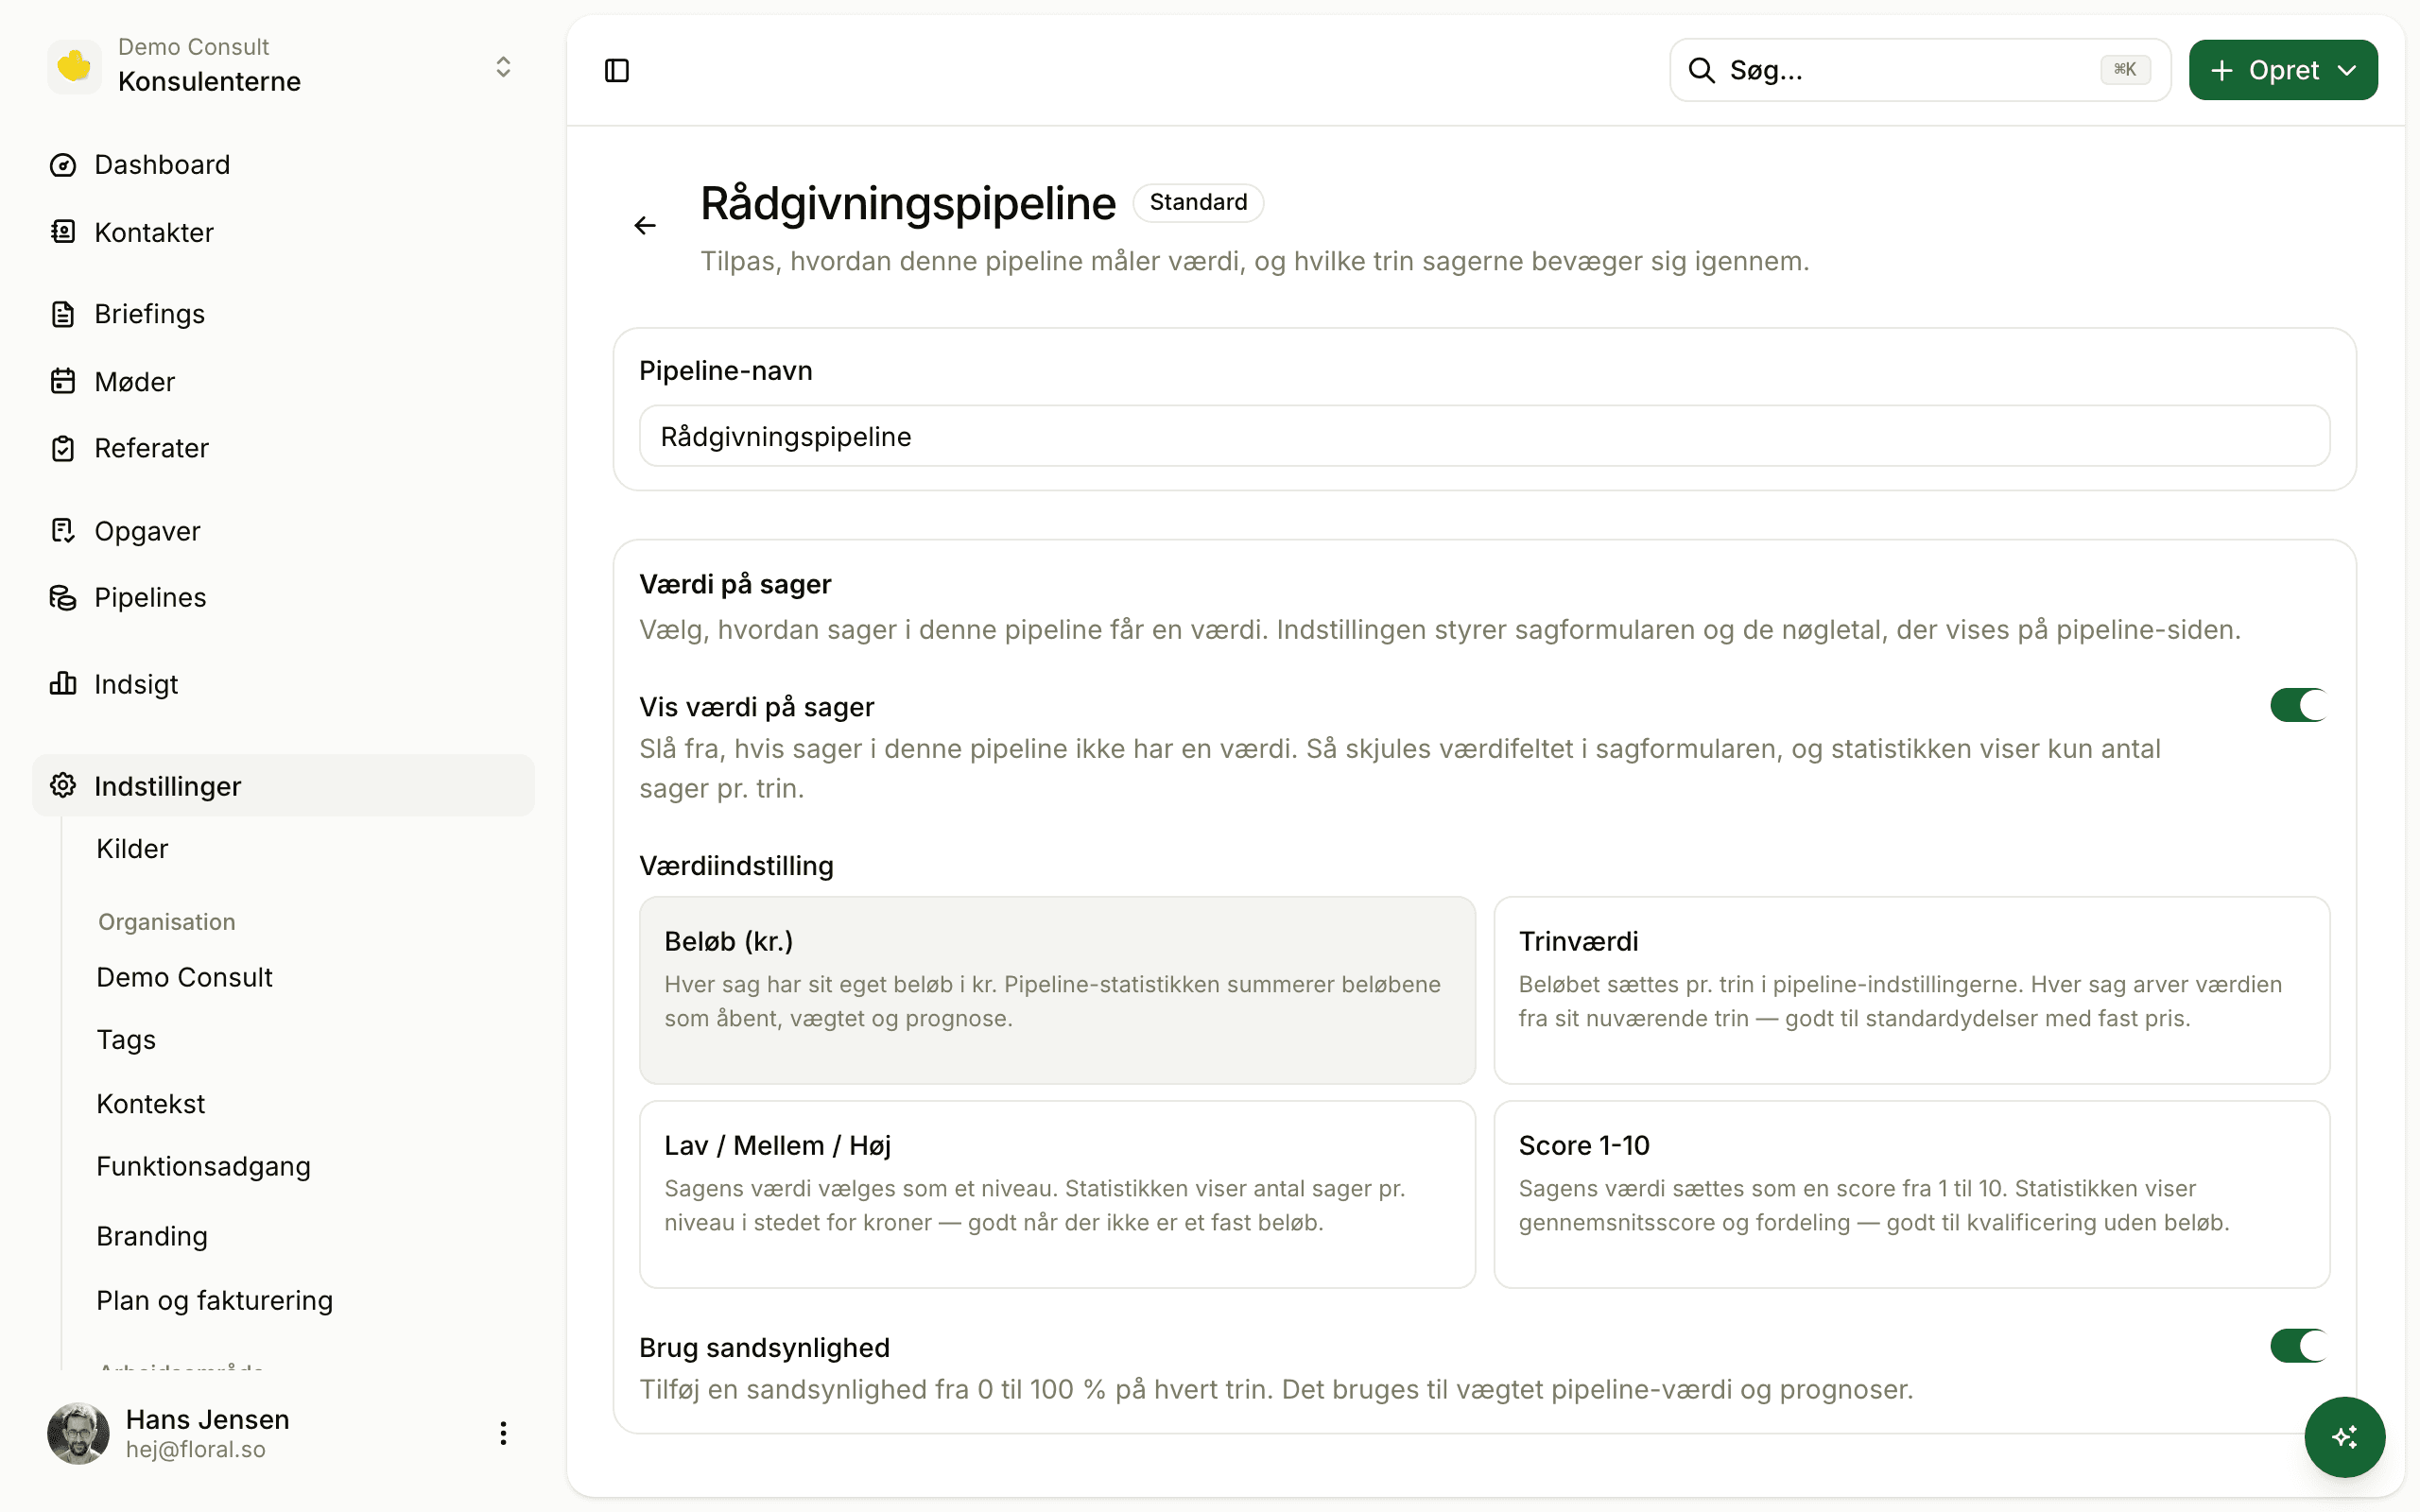
Not every deal lives or dies on DKK
Amount (kr.)
Classic value-per-deal. Forecast in DKK, weighted by stage probability.
Stage-based
Each stage carries a default value. Deals inherit. Good for early funnels where DKK is noise.
Low / Medium / High
Qualitative tier. Quick to assign, useful when DKK is not the right measure (consulting hours, partnership deals).
1–10 score
Composite score for teams that judge deals on multiple factors (strategic fit, urgency, champion strength).
Or turn it off
Hide value and probability entirely. The pipeline becomes a clean count-per-stage triage view.
Multiple pipelines
New business, upsell, reactivation — each with its own value mode and stages. One workspace, many sales motions.
The small stuff that adds up
Auto-win / auto-lose
Mark a stage as won or lost; dragging there sets the deal outcome automatically.
Forecast strip
Weighted open value, deal count, total open value — visible at all times above the board.
Per-user preference
Kanban or table — each teammate picks their default. The choice persists across sessions.
Frequently asked
Yes. Most teams run separate pipelines for new business, upsell/expansion, and reactivation — each with its own stages, probabilities, and value mode. Switch between them with one click.
How Floral measures a deal’s worth. Four options per pipeline: kr. amount per deal, stage-based (deal inherits value from stage), qualitative Low/Medium/High, or a 1–10 score. Pick what suits how your team actually evaluates deals — not just "how many DKK".
Yes. For early-stage prospect pipelines where dollar values are noise, hide both value and probability — the pipeline becomes a clean count-per-stage view.
Both. Same data, two views. Each teammate picks their preferred default; switching is one click. Bulk actions work in both views.
You can mark stages as auto-win or auto-lose, so dragging into "Won" or "Closed lost" automatically sets the deal’s outcome. The rest stays manual.
Build a pipeline that fits your sales motion
Join the CRM beta. Set up your first pipeline in 10 minutes.