See how meetings turn into outcomes
Floral measures what most teams do not: the meeting layer underneath the pipeline. Who is meeting whom, how often, with what prep, and how that translates into approved summaries and forward motion.
One dashboard for the meeting layer
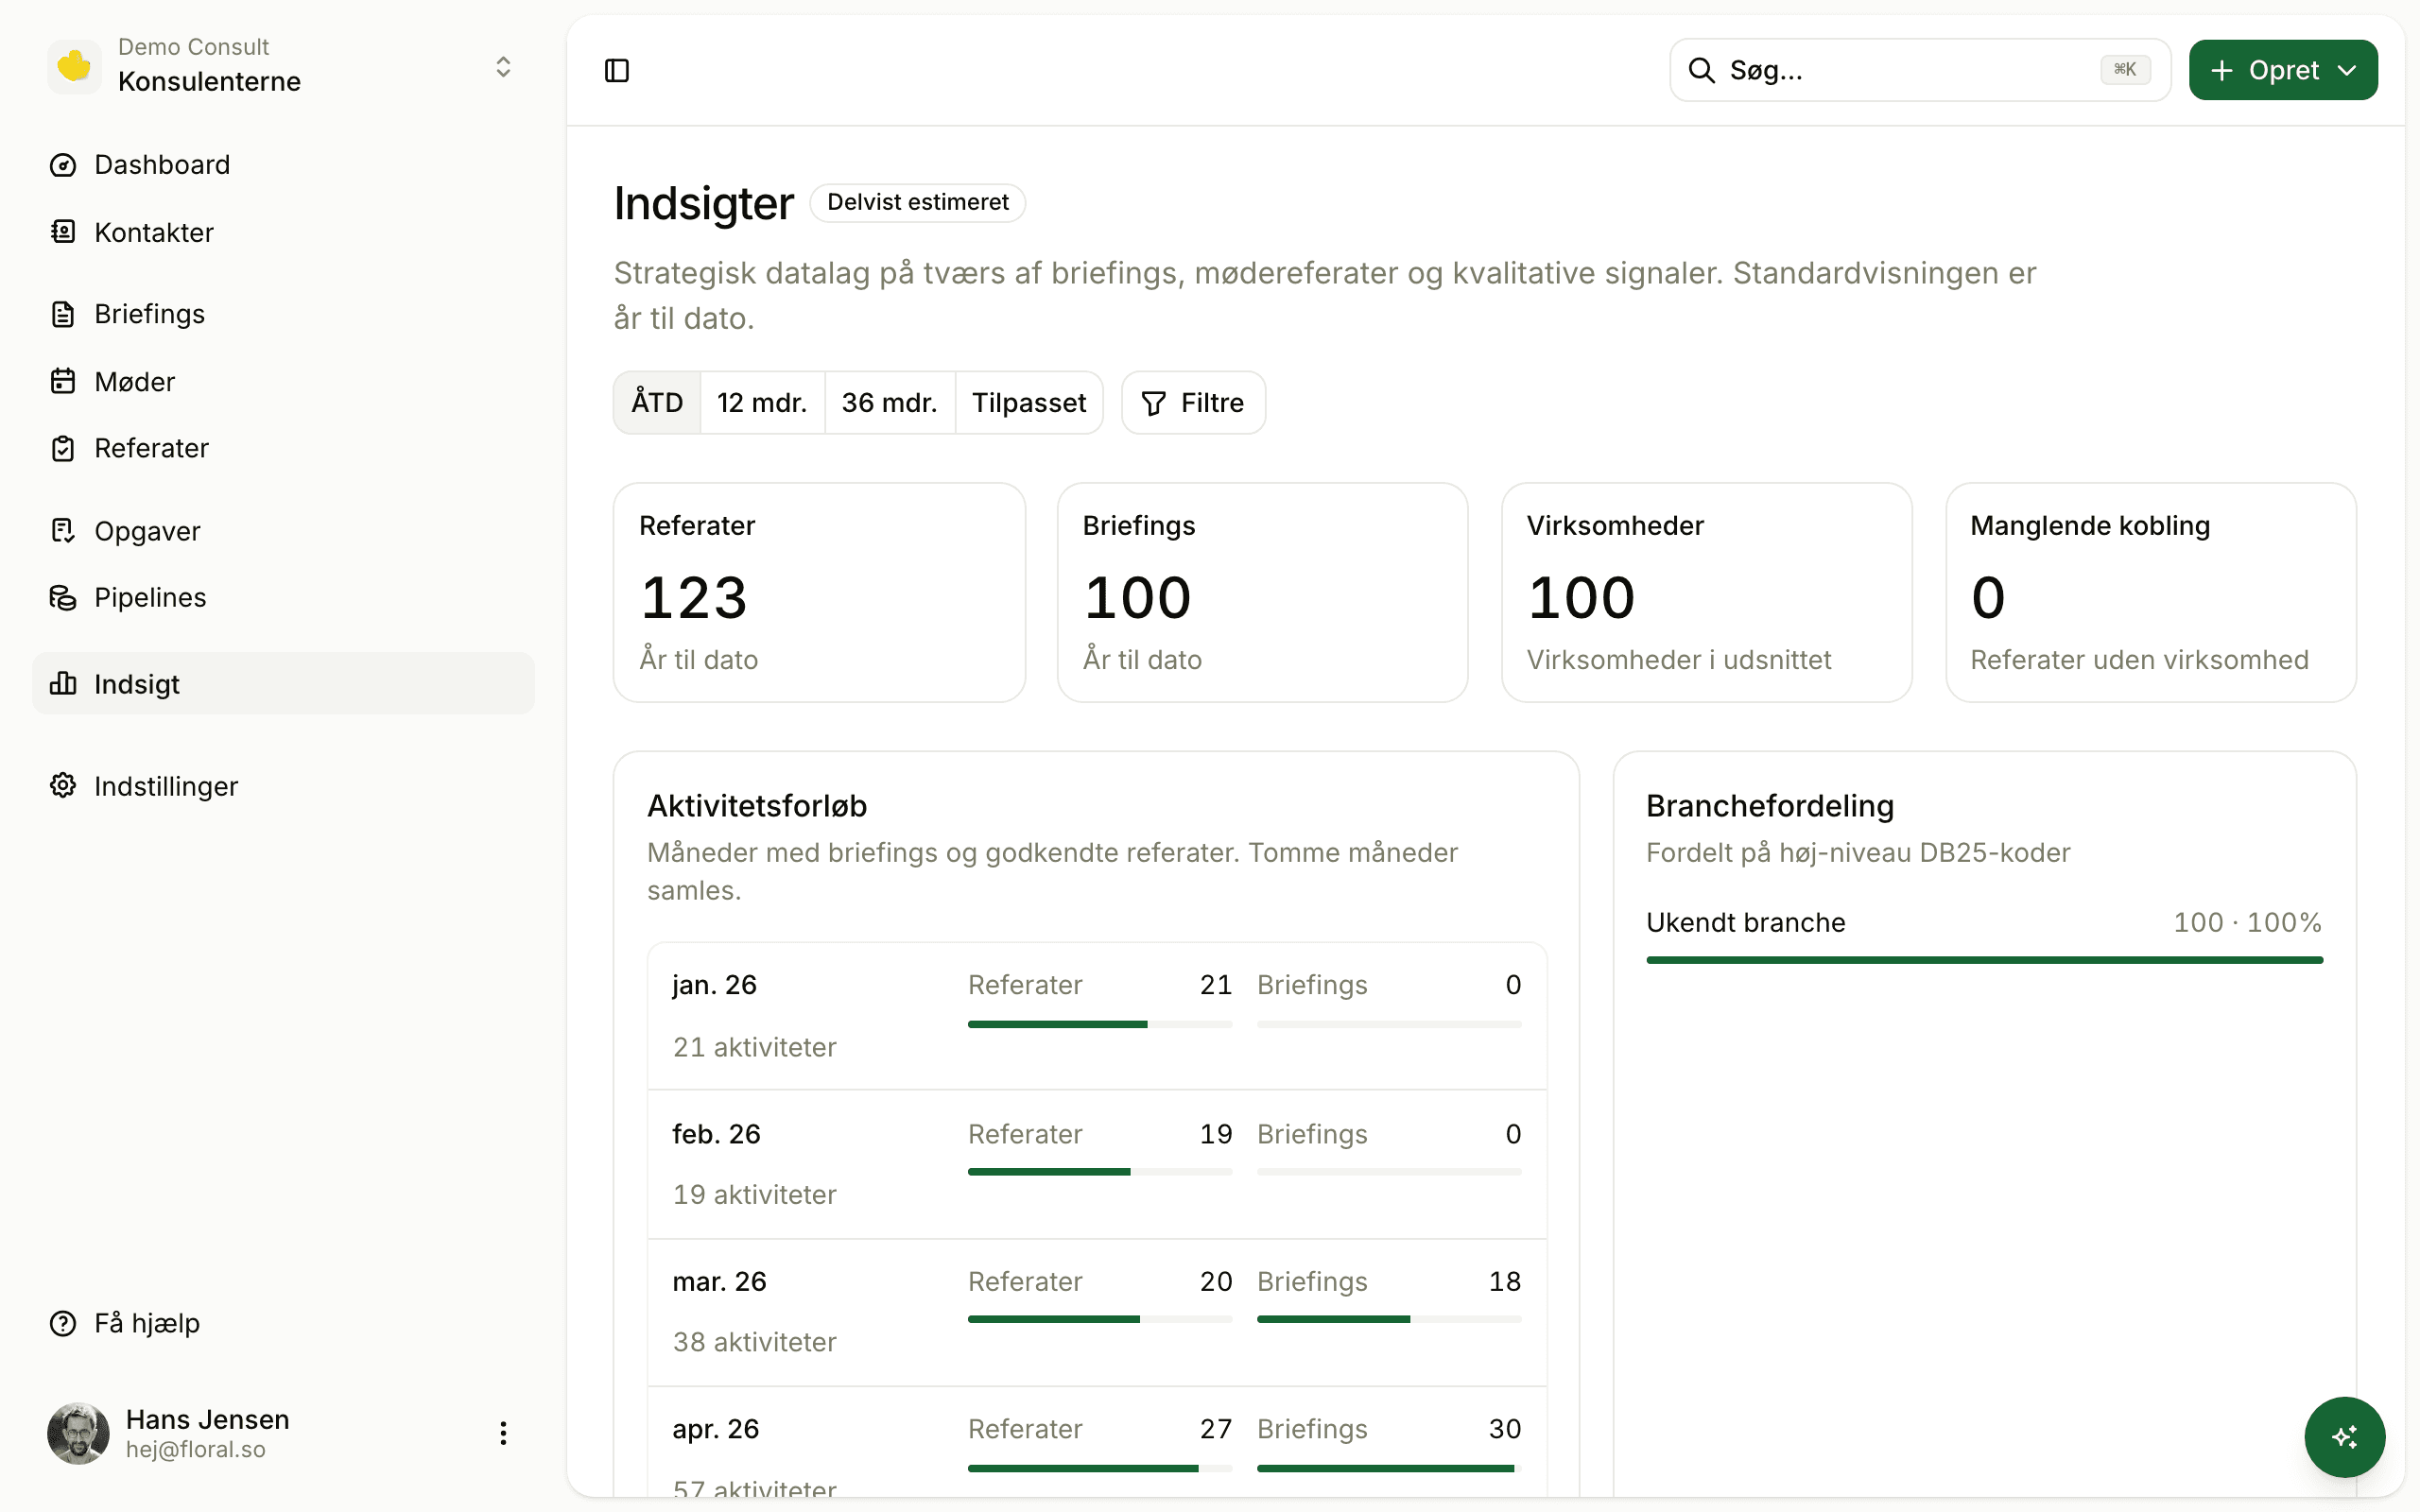
Meeting volume trends
Track how many meetings the team books and runs each month. Spot drops before they hit the pipeline.
Time allocation
Customer-facing vs internal time. Per rep, per team. Useful for capacity planning and quota setting.
Briefing effectiveness
How often briefings are generated, opened, and used. Find the reps who skip prep and the briefings that go unread.
Approval throughput
Summary approval lag per rep. Long lags mean meetings going stale before they hit the CRM.
Chip filters
Filter by month, meeting type, owner, or category. Compare cohorts side-by-side.
Sortable views
Sort by volume, by lag, by ratio. Whatever question you have, the data is one click away.
Built for managers, useful for everyone
Sales managers
Spot reps who skip prep or let summaries sit unapproved. Coach to the leading indicators, not just to revenue.
Operations leaders
Track meeting volume and time allocation to plan capacity and identify training opportunities.
Individual reps
See your own meeting cadence, prep ratio, and summary lag. Useful for self-coaching and quarterly reviews.
Frequently asked
Meeting volume per rep, time allocation across customer-facing and internal time, briefing effectiveness (how often briefings are used vs ignored), summary throughput, and approval lag. Trends are shown month-over-month.
No — this measures the meeting activity itself, not the deal pipeline. With the CRM add-on, you get pipeline analytics on top; insights focuses on the meeting layer underneath.
By default, workspace admins. Members can see their own personal metrics. Per-user feature access lets admins open insights to specific managers if they want broader visibility.
Yes — by month, meeting type, owner, or category. Use the chip filters at the top of the insights page.
Insights are visualised in-app. CSV export of the underlying data is on the roadmap; in the meantime, get in touch and we can run the report for you.
Coach to leading indicators
Sign up, run a few meetings, and see what the data tells you a month from now.